UK Wedding Spend Per Guest: Why It Hits £272

Key Takeaways
- UK spend per wedding guest reached £272 in 2025, up 4% from £261 in 2024 and 29% from £210 in 2019
- Hitched, Bridebook and Sonas all converge within £6 of each other on this figure
- Guest counts have fallen from ~100 in 2019 to 83-89 in 2025, yet per-guest spend keeps rising
- Below 80 guests, fixed costs push per-guest spend sharply higher — a 50-guest wedding runs at £303 per head
- Food and drink alone accounts for around £186 of the £272 average per-guest cost
- London per-guest spend is the highest in the UK, running 12-15% above the national average
The average UK wedding spent £272 per guest in 2025. That figure comes from Hitched’s annual study of 2,020 UK newlyweds, cross-checked against Bridebook’s equivalent (£278 per head) and Sonas’s industry-side data (£272 exactly). All three converge within £6. The number has risen every year since 2019, when it stood at £210. Yet guest lists have shrunk over the same period, from around 100 guests in 2019 to 83-89 in 2025. Smaller weddings are more expensive per person. This is the central paradox of the 2026 UK wedding market.
Key takeaways
- ✓ UK spend per wedding guest: £272 in 2025, up 4% year-on-year and 29% since 2019
- ✓ Hitched, Bridebook and Sonas all converge within £6 on this figure
- ✓ Guest counts have fallen from ~100 (2019) to 83-89 (2025), yet per-guest spend keeps climbing
- ✓ Below 80 guests, fixed costs push per-head spend to £303 or above
- ✓ Food and drink alone accounts for around £186 of the £272 per-guest average
- ✓ London per-guest spend runs 12-15% above the national average
By Matt Ward, Editor at Weddings Hub. I’ve tracked UK wedding cost data across Hitched, Bridebook, Sonas, For Better For Worse and The Wedding Industry Awards reports since 2018. This article draws on published 2026 data from Hitched (2,020 newlywed survey), Bridebook UK Wedding Report (7,000+ couples), and Sonas Catering’s published industry data.
How the £272 figure is calculated
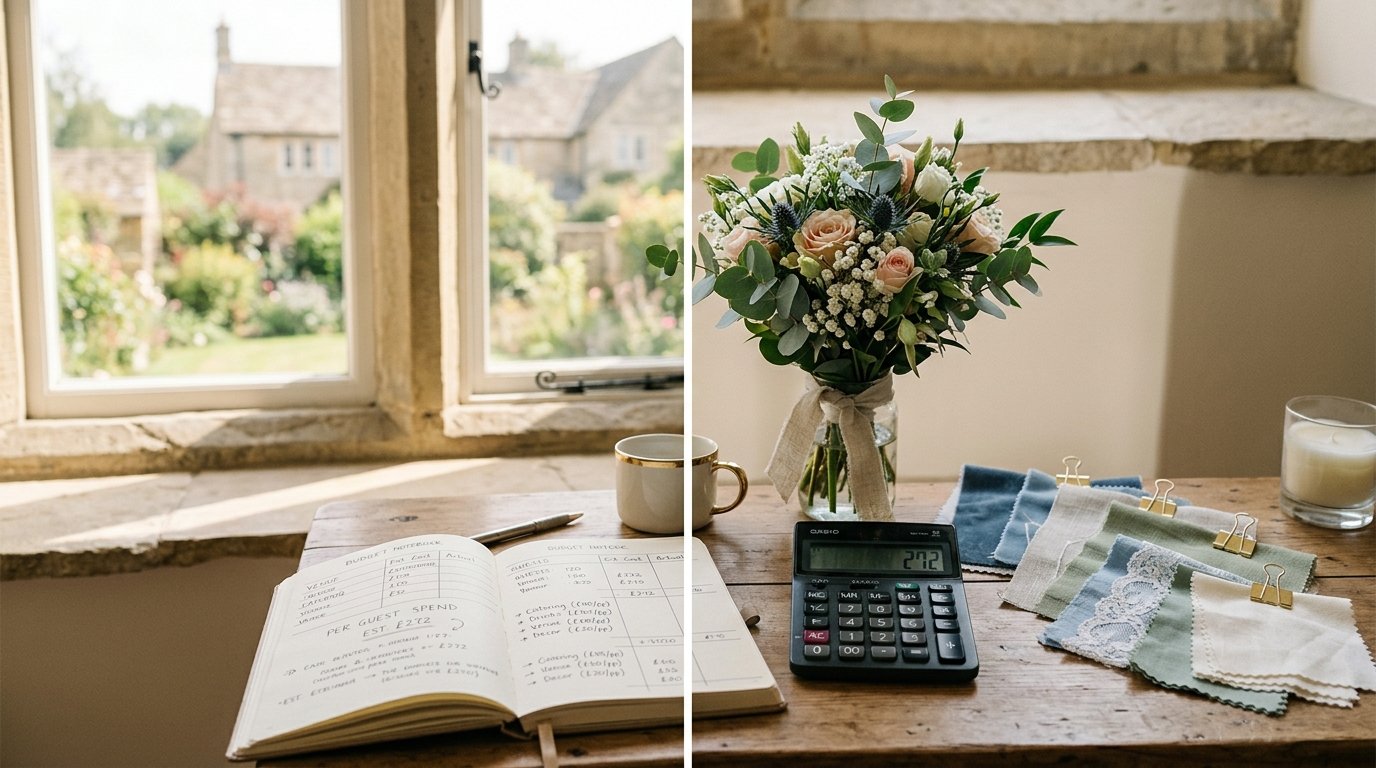
The £272 per-guest figure is a blended total, not a catering-only number. It is arrived at by taking the total average wedding spend and dividing by the average guest count.
Using Hitched’s figures:
- Total average spend: £21,990
- Average guest count: approximately 81 guests
- Per-guest blended cost: £271.48, rounded to £272
Using Bridebook’s figures:
- Total average spend: £20,604
- Average guest count: approximately 74 guests (Bridebook’s modal range)
- Per-guest blended cost: £278.43, rounded to £278
Sonas publishes an industry-side figure based on actual caterer and venue data rather than couple surveys. Their 2025 number is £272 exactly, which aligns with Hitched and suggests the survey-based figures are reliable.
The £272 covers everything: venue hire, catering, photography, entertainment, flowers, attire and rings, spread across the guest count. It is not the food cost per head, which runs lower (around £70-90 per head for a full-service wedding). It is a useful planning number for understanding total per-head exposure.
Why the number keeps rising
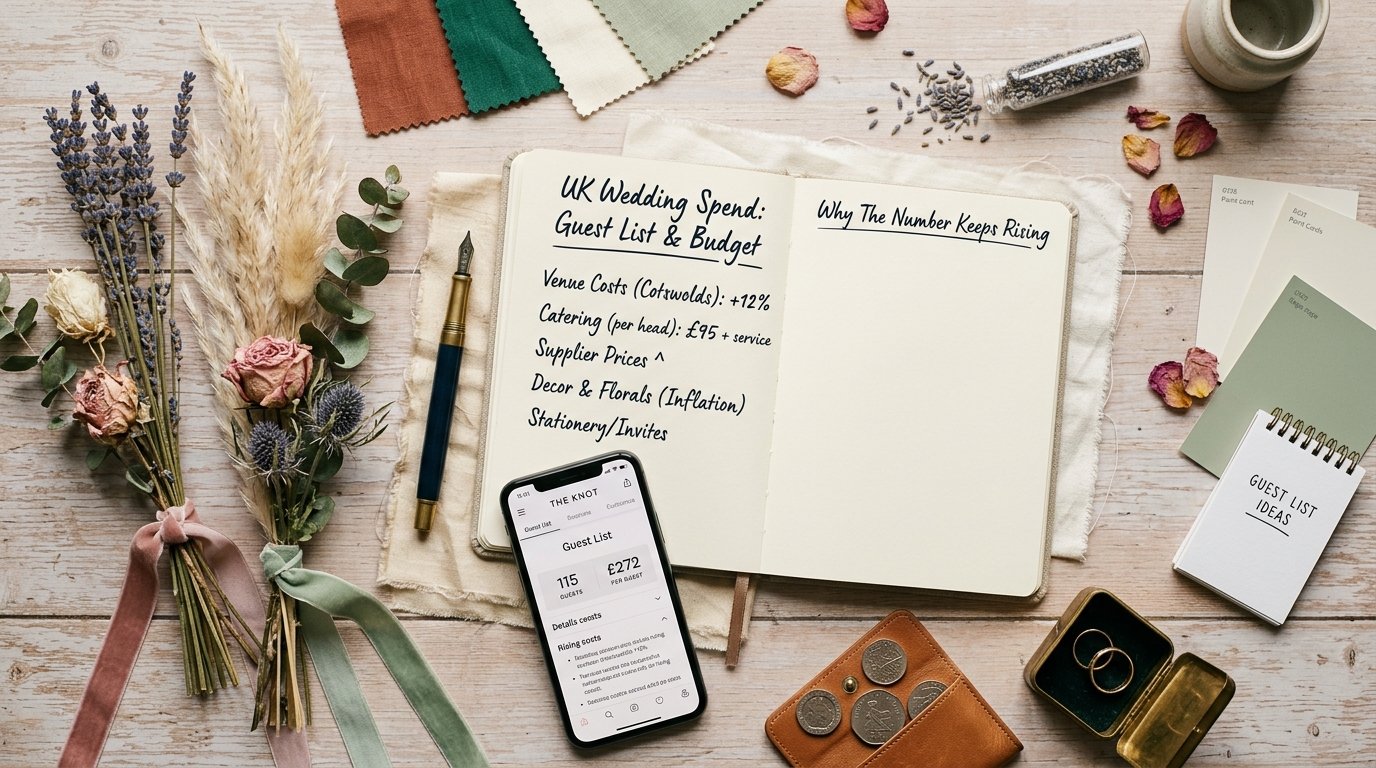
The paradox of UK wedding data is that guest lists have shrunk by 11-17% since 2019, yet per-guest spend has risen by 29%. Three forces explain this.
Force 1: Fixed costs do not shrink when you cut guests
A UK wedding has a fixed cost structure and a variable cost structure.
Fixed costs include venue hire (at a significant fraction), photography, videography, wedding planner, hair and makeup, the cake, and entertainment. These costs are broadly the same whether you have 60 guests or 100. When you cut your guest list by 20%, you do not cut your fixed costs by 20%. You may save on stationery, favours and chair covers. The structural fixed costs stay.
Variable costs include catering per head, drinks per head, seating, linen and table decorations per table, and favours. These fall roughly linearly with guest count.
For a typical wedding with £21,990 in total spend, our estimates suggest around £11,000-12,000 is fixed and £9,000-10,000 is variable. Cut 20 guests from a 100-guest wedding and you save roughly £2,000-2,500, not £4,400.
The maths: per-guest spend rises when the fixed cost denominator falls faster than the actual saving.
Force 2: Catering standards have risen materially
The typical UK wedding catering spend in 2019 was close to £55 per head. By 2025, it had reached approximately £70-90 per head for a full-service wedding, driven by a 23% cumulative food and non-alcoholic drink inflation between 2021 and 2025 (ONS data).
Beyond inflation, the standard itself has shifted. The 2019 wedding more often featured a hot buffet supper for 100 evening guests. The 2026 wedding more often features a plated three-course meal for 75 day guests with arrival drinks, canapés, a champagne toast and an evening food station. Canapés alone can run to £18-25 per head from a premium caterer.
More couples are choosing sit-down plated meals over buffets. Sonas data shows the buffet share of UK wedding catering fell from 41% in 2019 to 28% in 2025. Plated meals cost more per head. As the mix shifts, the average per-head spend rises even when the underlying inflation is controlled for.
Force 3: Supplier consolidation and minimum spend requirements
Between 2022 and 2025, several large venue groups acquired independent venues across the UK. Group-owned venues frequently run higher per-head minimums on catering and stricter exclusivity requirements on suppliers. These requirements effectively set a floor on variable costs that independent venues often do not have.
The pattern is most visible in the South East and East of England, where group-owned rural venues have accumulated market share. It partly explains why London and the South East show per-guest figures 12-15% above the national average.
Per-guest spend by guest count
The relationship between guest list size and per-guest cost is non-linear. Below a certain threshold, fixed costs dominate and per-guest spend spikes.
| Guest count | Total estimated spend | Estimated per-guest cost | vs national average |
|---|---|---|---|
| 30-50 (micro-wedding) | £14,000-£16,500 | £303-£350 | +11-29% |
| 51-80 | £17,500-£21,000 | £278-£303 | +2-11% |
| 81-100 (national modal) | £21,000-£23,500 | £258-£274 | -5 to 0% |
| 101-130 | £24,000-£29,000 | £222-£253 | -7 to -18% |
| 131-200 | £29,000-£40,000 | £195-£221 | -19 to -28% |
This table illustrates the fixed-cost effect directly. A micro-wedding of 40 guests runs at £303-£350 per head despite spending less in total. A larger wedding of 150 guests runs at £195-£221 per head — nearly a third below the average — despite a much higher total cost.
The practical implication: cutting your guest list from 90 to 60 is not a straightforward saving. You may save £7,500-9,000 in variable costs, but your per-guest spend will rise from £272 to £290-310. The total saving is real; the per-guest trajectory is counterintuitive.
Per-guest spend by UK region
Regional data from Hitched, Bridebook and Sonas combined.
| Region | Estimated per-guest cost | vs national average |
|---|---|---|
| London | £304-£317 | +12-17% |
| South East | £291-£303 | +7-11% |
| East of England | £286-£295 | +5-8% |
| Scotland | £274-£282 | +1-4% |
| South West | £268-£278 | -1 to +2% |
| West Midlands | £249-£261 | -4 to -8% |
| Yorkshire | £242-£255 | -6 to -11% |
| North East | £228-£241 | -11 to -16% |
| Northern Ireland | £231-£244 | -10 to -15% |
| North West | £212-£228 | -16 to -22% |
| Wales | £191-£207 | -24 to -30% |
The London premium is driven by a combination of higher venue hire rates, higher caterer prices, and a higher proportion of group-owned venues with per-head minimum spends. Wales and the North West offer the greatest discount to the national average, with per-guest costs that are 24-30% below the London figure.
What the food and drink share looks like
Of the £272 average per-guest blended cost, food and drink accounts for the largest share.
| Cost element | Average per-guest share | Notes |
|---|---|---|
| Catering (food) | £98-£112 | Full-service plated dinner estimate |
| Drinks (bar package) | £72-£85 | Arrival drinks, dinner wine, toast, bar |
| Venue hire (allocated per head) | £42-£48 | £3,710 average divided by 81 guests |
| Photography + video (per head) | £25-£28 | £2,060 average divided by 81 guests |
| Entertainment (per head) | £13-£16 | Band/DJ average divided by guest count |
| Flowers + decor (per head) | £16-£19 | Table decorations, ceremony flowers |
| Other (per head) | £5-£8 | Favours, stationery, transport share |
Food and drink together account for £170-£197 of the £272 per-guest blended cost. This is consistent with Bridebook’s finding that catering is the single largest budget line at 33% of total spend.
What rising per-guest spend means for planning
Guest count is the biggest controllable variable. Cutting your photographer budget by £500 saves £500. Cutting your guest list by 10 people saves £2,720 at the current per-head rate. But cutting from 90 to 40 guests does not save £13,600 linearly. The fixed cost floor means the real saving is closer to £7,500-9,000.
The 80-guest break-even. Our modelling suggests 80 guests is approximately where the per-guest fixed-cost effect starts to bite materially. Below 80, per-guest spend rises noticeably. Above 80, per-guest cost falls toward the national average. This explains why couples who want an intimate wedding often find that 60 guests costs almost as much per head as 80.
Weekday and Sunday bookings reduce the fixed cost floor. Many UK venues reduce hire fees by 18-28% for Monday-Thursday weddings and 12-18% for Sundays. This lowers the fixed cost component and reduces the per-guest floor.
Catering format is the most effective variable. Moving from a fully plated three-course dinner to a sharing-style or high-end buffet format can cut catering per-head by £20-30. At 80 guests, that is a £1,600-2,400 saving without reducing guest numbers.
Frequently asked questions
How much do UK couples spend per wedding guest in 2026?
The average is £272 per guest, based on Hitched’s 2026 report of 2,020 newlyweds. Bridebook’s equivalent figure works out at £278 per head. Sonas’s industry-side data gives exactly £272. All three converge within £6, which gives the number high reliability across different methodologies.
Why is UK wedding spend per guest rising if guest lists are getting smaller?
Fixed costs do not shrink when you cut guests. Venue hire, photography, entertainment and the wedding planner are roughly the same whether you have 60 or 100 guests. Catering standards have also risen materially, with more couples choosing plated meals over buffets. Both forces push per-guest spend upward despite smaller lists.
What is included in the £272 per-guest figure?
The £272 is a blended total cost spread across all guests, not a catering-only number. It covers venue hire, catering, photography, entertainment, flowers, attire and rings, divided by the average guest count. The catering-only per-head cost for a full-service wedding is approximately £70-90.
How does guest count affect total wedding cost?
Each guest costs roughly £272 in total, but the marginal variable cost per additional guest is around £70-90 (food and drink). Fixed costs like venue hire and photography are not affected by adding or removing individual guests. The variable cost per head is meaningful in aggregate but modest for each individual addition.
What is the cheapest UK region for per-guest wedding spend?
Wales and the North West are the most affordable regions. Welsh per-guest costs average £191-£207, against a national average of £272. The North West averages £212-£228 per head. These regions offer 24-30% discounts to London equivalents, driven by lower venue hire rates and more competitive caterer pricing.
How can I reduce per-guest spend at my UK wedding?
The three most effective levers are: review your guest list against the 80-person break-even; switch to a sharing-style or high-quality buffet catering format (saving £20-30 per head); and book a Monday-Thursday or Sunday date (saving 12-28% on venue hire). Cutting small-ticket items like favours saves money but does not move the per-head number materially.
Related articles
Frequently Asked Questions
How much do UK couples spend per wedding guest in 2026?
The average is £272 per guest, based on Hitched's 2026 report of 2,020 newlyweds. Bridebook's figure works out at £278 per head. Both are consistent with Sonas's industry-side data.
Why is UK wedding spend per guest rising if guest lists are getting smaller?
Fixed costs (venue hire, photography, entertainment) do not fall when you cut guests. Catering standards have also risen, with more couples choosing plated three-course meals over buffets. Both forces push per-guest spend up.
What is included in the £272 per-guest figure?
The £272 is a blended per-guest cost covering venue hire, catering, photography, entertainment, flowers, attire and rings, spread across the number of guests. It is not the catering cost alone.
How does guest count affect total wedding cost?
Each additional guest costs roughly £272 in total, but the marginal impact on fixed costs (venue, photographer) is zero. The variable cost per additional guest — mainly food and drink — is around £70-£90 per head for a full-service wedding.
What is the cheapest UK region for per-guest wedding spend?
Wales and the North West are the most affordable regions. Welsh per-guest costs average around £197, against a national average of £272. The North West averages around £212 per head.
How can I reduce per-guest spend at my UK wedding?
The three most effective levers are: cut the guest list below the variable-cost break-even point, move from a fully plated dinner to a high-quality buffet or sharing-style menu, and consider weekday or Sunday bookings where venue hire is 18-28% lower.